PDPlot Product Details
PDPlot is an easy to use application developed for Petroleum Reservoir Pressure versus Depth Plotting and Analysis.
Though the use of PDPlot you will ultimately :
- Save a significant amount of time and shift the emphasis from preparation and presentation time to interpretation time,
- Achieve better pressure versus depth analyses, and
- Deliver presentation quality plots and graphics quickly
This application was developed to replace the numerous spreadsheet attempts that do the same task, but at the same time include all the various Reservoir Fluid (gas, oil and water) calculations of density to cross plot against the implicit fluid density plotted on a Pressure versus Depth chart.
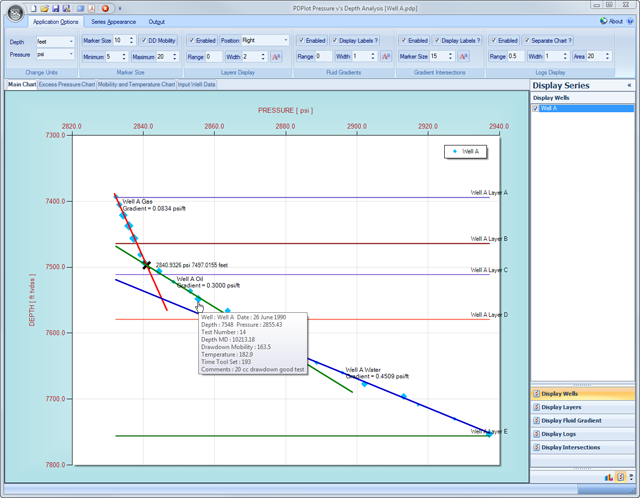
The user can also display single and multiple wells very easily, together with reservoir layer interval information and log displays, all on the same chart as the pressure v's depth data, together with explicit density gradients or regressed fluid gradients.
Easily Input Data
Throughout the application, the user can choose to input data manually, or via an ASCII import facility, or by standard Windows copy and paste or drag and drop functionality. Therefore the user should not have to re-type any values into PDPlot if the data is available digitally from another source, ie. Microsoft Excel.
Fluid Gradient Calculations
Fluid gradient or density calculations are input into the application via two different methods. The first method explicitly calculates fluid density with the knowledge of other fluid properties. The second method is a simple linear regression through selected chart data points.
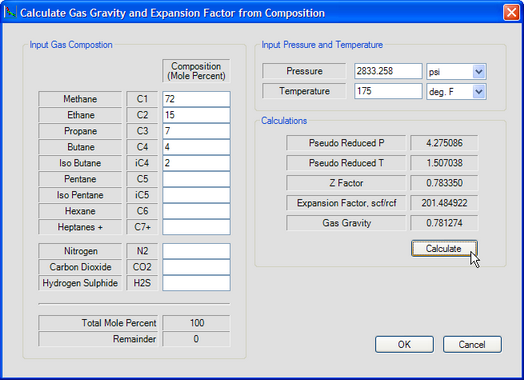
Chart Operations
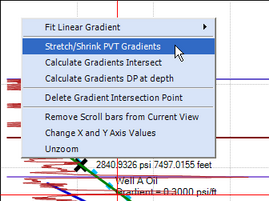
Zooming and scrolling within the charts couldn't be easier ! Simply click and drag your mouse with the chart area. Extensive tooltips are provided, dependant on the level of data entered, to help the user interpret and display representative fluid pressure gradients. Stretching and shrinking fluid gradients within the chart are simply performed by clicking and dragging your mouse. Calculating and displaying intersections of fluid gradients and gradient pressure differences are provided for within the chart area by selecting a context menu.
For individual pressure depth series values, the user can either choose to have a fixed marker size, or link the marker size to the value of drawdown mobility, ie., the higher the value of drawdown mobility the larger the marker size.
The user can copy any the charts to the Windows clipboard, and paste into external applications such as Microsoft Powerpoint or Word. Alternatively, the user can save the charts as a graphic image in various formats including JPG and PNG.
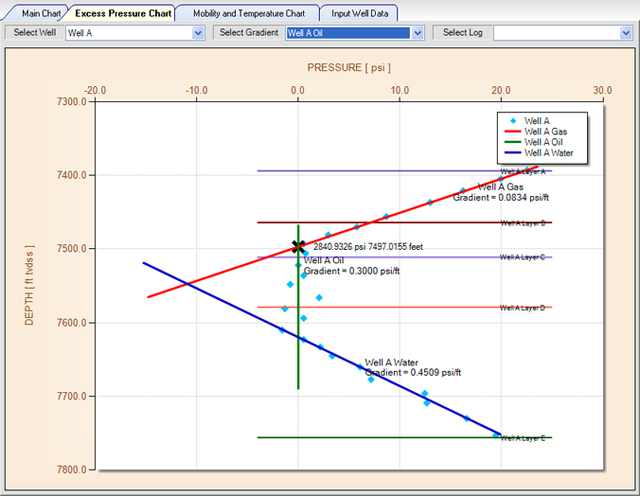
An alternative chart display - the Excess Pressure chart
The excess pressure chart is an alternative pressure v's depth display. This display normalises the pressure data for a specific Fluid gradient. This technique essentially removes the effects of the selected fluid density, and therefore improves the visualisation of small density differences and pressure barriers that may not be as apparent on standard pressure v's depth plots. For additional quick data quality control, a third chart is provided that allows the user to plot drawdown mobility and/or temperature as a function of true vertical depth or measured depth. All display aspects (ie, colour and fonts) can easily be changed via toggling through a navigation panel permanently displayed on the right has side of the application.