|

  
|
||
|
|
||
Dykstra and Parsons introduced the concept of the permeability variation V, which is designed to describe the degree of heterogeneity within the reservoir. Values for this coefficient range between zero for a completely homogeneous system and one for a completely heterogeneous system.
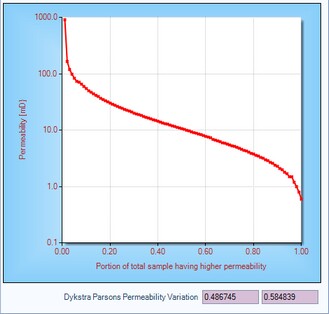
To obtain the value of permeability variation V, the permeability dataset is sorted from minimum to maximum and displayed on a chart of log probability scale, as shown below.
The equation for permeability variation V is included below.
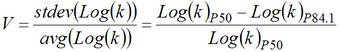
Both of the above equations have been implemented into this routine. The significance of the Log(k) at a probability value of 84.1% is that it is the equivalent of one standard deviation away from the 50% probability value assuming a log normal distribution (which permeability distributions often displays this characteristic).
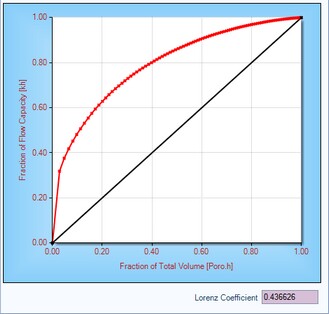
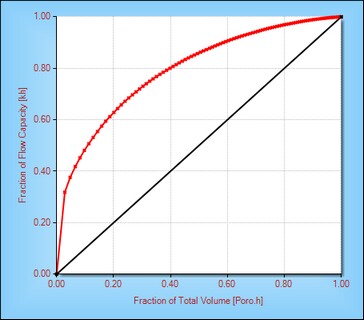
In 1950, Schmalz and Rahme proposed a single term for characterizing the permeability distribution within a pay section. Referring to the chart below, they defined the Lorenz coefficient of heterogeneity as the (area between the green curve and the red curve) / (area between the red curve and the X axis).
The value of the Lorenz coefficient ranges from 0 to 1, a uniform permeability reservoir having a Lorenz coefficient of zero.
This calculation and display has also been included within this routine.
The following example is taken from data presented in Craig's SPE Monograph "The Reservoir Engineering Aspects of Waterflooding", to better explain the various aspects of this routine.
Once the routine is launched the following input screen is displayed.
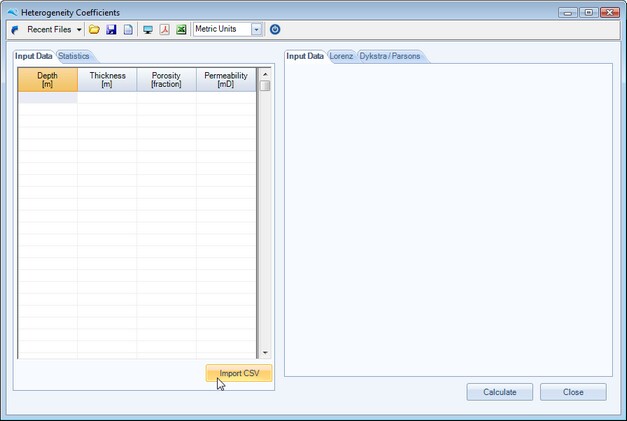
The user can input data either by using the Import CSV button to load a comma delimited ASCII file, or simply copy and paste or drag and drop data from an external application, such as Microsoft Excel.
Once the data has been input, the user should press the calculate button to display the charts of porosity and permeability versus depth, together with the Lorenz and Dykstra-Parsons charts and calculated coefficients. At this point the following should be displayed.

Selecting the Lorenz TAB display the Lorenz chart and calculated coefficient. Likewise, selecting the Dykstra-Parsons TAB display the Dykstra-Parsons chart and calculated coefficients. Both examples are provided below. The first coefficient in the Dykstra-Parsons TAB is calculated from the Average and Standard Deviation, whereas the second coefficient is calculated from interpolated values of P50 and P84.1.
|
|
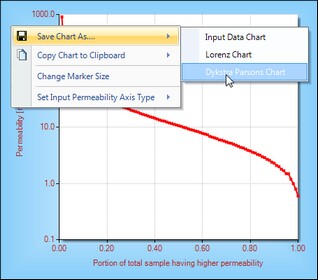
Exporting Charts to Clipboard or File
The user can quickly copy and paste the chart to the Windows clipboard or save the chart as a graphic image file by selecting the context menu (right-muse click) while the mouse is within the chart area. The following should be displayed.
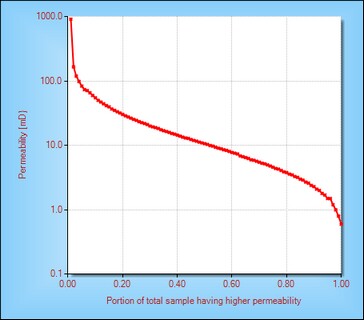
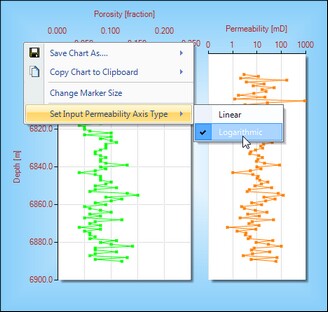
Also the user can also choose to display the permeability versus depth chart as a logarithmic scale for permeability, is required. This is also shown below.
References:
Dykstra, H., Parsons, R., "The Prediction of Oil Recovery by Water Flood", Secondary Recovery of Oil in the United States, 2nd ed. American Petroleum Institute, 1950
Schmalz, J. P. and Rahme, H. D., "The Variation of Waterflood Performance With Variation in Permeability Profile", Prod. Monthly, 1950.
Craig, Jr., F., "The Reservoir Engineering Aspects of Waterflooding", Society of Petroleum Engineers, 1971
Page url: http://www.YOURSERVER.com/help/index.html?relative_permeability_fitting.htm